Unified Catalogues
This page provides links to the CFHTLS unified catalogues and documentation on how they were generated. The catalogues can be retrieved as large ASCII files below or can be queried on the Catalogue queries page.
Introduction
CFHTLS catalogues were produced by MegaPipe in 2008 (for the Deep fields) early 2009 (for the Wide). These catalogues were split by band and by pointing. They were produced by running SExtractor on the each image individually. Users who wanted to use the catalogues had to download and merge the individual catalogues themselves.
To increase the user-friendliness of the catalogues, the individual catalogues have now been merged. Each merged catalogue contains measurements in all 5 of the ugriz MegaCam filters and covers an entire survey (either the Wide or the Deep).
Separate catalogues were generated using each of the 5 bands as a reference/detection image. Thus there is an u-selected, g-selected, r-selected, i-selected and z-selected catalogue for each survey each suiting to different science goals. (i-selected for general galaxy population studies, z-selected if you are looking for i-band dropouts, etc.). Although the catalogues are selected in a single filter, measurements are made in all 5 filters for each catalogue, removing the need to consult multiple catalogues. There are thus a total of 5x2=10 separate catalogues, each complete in itself, but with different detection characteristics.
Catalogues
The following table provides a few statistics about the catalogues and links to the ASCII versions.
| Survey | Selection Filter |
Number of rows |
Area (Deg2) |
Masked Area (Deg2) |
Full catalogue | Concise catalogue |
|---|---|---|---|---|---|---|
| Deep | U | 990 000 | 4.02704 | 3.64042 | D.U.cat.gz (498Mb) | D.U.con.cat.gz (140Mb) |
| Deep | G | 1 600 000 | 4.02704 | 3.64042 | D.G.cat.gz (768Mb) | D.G.con.cat.gz (217Mb) |
| Deep | R | 1 600 000 | 4.02704 | 3.64042 | D.R.cat.gz (768Mb) | D.R.con.cat.gz (217Mb) |
| Deep | I | 1 600 000 | 4.02704 | 3.64042 | D.I.cat.gz (743Mb) | D.I.con.cat.gz (210Mb) |
| Deep | Z | 1 100 000 | 4.02704 | 3.64042 | D.Z.cat.gz (529Mb) | D.Z.con.cat.gz (150Mb) |
| Wide | U | 19 000 000 | 152.33481 | 148.32196 | W.U.cat.gz (8.6Gb) | W.U.con.cat.gz (2.4Gb) |
| Wide | G | 32 000 000 | 152.33481 | 146.20048 | W.G.cat.gz (15Gb) | W.G.con.cat.gz (4.1Gb) |
| Wide | R | 28 000 000 | 152.33481 | 144.69447 | W.R.cat.gz (13Gb) | W.R.con.cat.gz (3.6Gb) |
| Wide | I | 28 000 000 | 152.33481 | 144.80211 | W.I.cat.gz (13Gb) | W.I.con.cat.gz (3.6Gb) |
| Wide | Z | 19 000 000 | 152.33481 | 145.18961 | W.Z.cat.gz (8.8Gb) | W.Z.con.cat.gz (2.5Gb) |
Method
The basic procedure is:
- Individual catalogue generation: SExtractor is run in double-image mode on the individual images.
- Catalogue masking: Areas where photometric measurements and detections may be compromised are masked.
- Catalogue merging: The masked catalogues for each pointing are combined and redundant sources (ones which appear in more than one individual catalogues) are removed.
A number of other methods were considered:
Instead of generating catalogues pointing-by-pointing and then merging the catalogues one could SWarp together all the images for each Wide field into a single enormous image and run SExtractor on that image. This has advantage of eliminating the catalogue merging step, which involves a fair amount of book-keeping. The disadvantage is that these images are unwieldy. They would measure up to 140 000 pixels across and be 100 Gb in size. While it may be possible (although difficult) to run SExtractor on such images, one cannot distribute such images over the web. Users would be present with catalogues for which they cannot view the source image.
Instead generating separate catalogue for each filter, one could build some sort of master image containing flux from each band, for example a chi-squared image. One could then use SExtractor in double-image mode with the master image as a detection image. This has the advantage of simplicity: it produces a single catalogue. However, the 5 bands are not even in depth. The z-band in particular is much noisier than the other 4. While adding the bands together produces a deeper image in theory (you now have photons from all wavelengths) in practice it is also noisier. Leaving out the noisier bands (uz) means that you no longer have a catalogue suitable for all purposes.
Instead of publishing a separate catalogue for each filter, one could merge the 5 catalogues into one. One could cross-identify sources common to different catalogues and merge their entries into a single entry. This again has the advantage of producing a single catalogue rather than several, and (if done correctly) eliminates the disadvantages of the previous master-image method. The trick, of course, is accurately and reliably cross-identifying the sources between filters. For bright, well separated sources this is easy. The MegaPipe images are registered to very high accuracy, making cross-identification by position fairly accurate. However the image quality and depth varies between different filters; objects that appear as single source in one filter may appear as two sources in another filter. Even if the cross-identification can be done correctly, the bookkeeping is non-trivial. That being said, it has work successfully for the SDSS and this option may be explored in the future.
In short, the easiest way to make a clean catalogue is to:
- merge the different pointings at the catalogue level rather than at the image level
- not to merge the catalogues for different filters but to generate multiple catalogues, one per filter.
In the age of SDSS, to makes less and less sense to have simple ASCII files (although these have their place). Therefore a database has been set up containing the catalogues. A query page has been set up to allow users to query the database in a flexible manner, either using canned queries or writing their own SQL.
A note on terminology: surveys, fields and pointings. The CFHTLS contains two surveys (the Deep and the Wide). Each survey has 4 fields (D1, W3 etc.) Each field contains one (for the Deep fields) or more (for the Wide fields) pointings (W1+0+0, W4-1-1 etc.)
Individual catalogue generation
The base point of the unified catalogues are the CFHTLS image stacks. In brief, the individual MegaCam input images are processed through MegaPipe. Accurate astrometric and photometric calibrations are applied to the images. The images are then shifted (according to the astrometric calibration) and scaled (according to photometric calibration) and stacked using SWarp. The images are grouped by pointing. The output images cover roughly one square degree.
SExtractor was run on the 5 images from each pointing using "double-image mode". In this mode, the detection of objects are done in one image (the reference image) and photometric (and other) measurements are done in the other (the measurement image). All possible image combinations were run for a total of 25 catalogues per pointing (5 possible reference images times 5 possible measurement images). These catalogues constitute the individual catalogues. Here is the SExtractor configuration file.
Catalogue masking
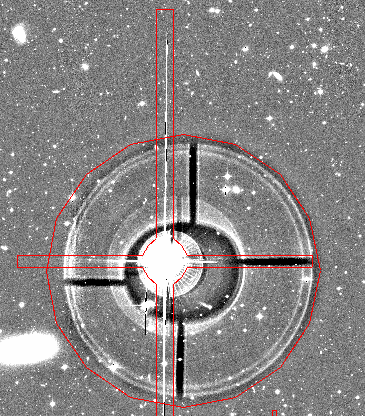
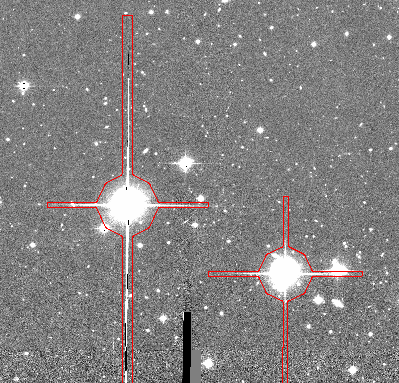
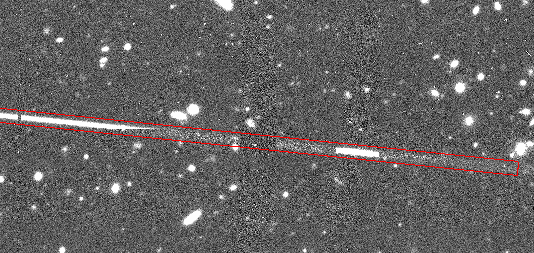
The catalogues were masked to identify areas where the detection and photometric measurements of sources may compromised. These areas include areas around brighter stars, diffraction and bleed spikes from the brightest stars and satellite/meteor trails. Also, in some cases the dither pattern of the input images was insufficient to provide uniform depth across the pointing. An automatic detection method was used to find the bright stars and the diffraction/bleed spikes. This was supplemented with laborious hand masking. The images below show examples of what was masked.
An example of bright star masking. Here the position of the bright star is taken from the the Guide Star Catalog. (SExtractor usually fails to correctly determine the centre of bright stars.) The pupil image is offset from position of the star towards the centre of the image by 0.022 times the distance between the star and the centre of the image.

An example of diffraction spike masking. The masking program masks the diffraction spikes out to a minimum distance (200 pixels) and then looks for extended bleed spikes (always in the y-direction). If they are detected it extends the mask until the end of the bleed trail.

An example of meteor trail masking. A meteor trail appears in a single input image. Where a large enough number input images are available, the trail disappears when the images are combined (using the median process) leaving at most some residual noise. However at the CCD boundaries of the MegaCam mosaic and over the bad columns of the input images, there may be less than the full number of images and the trail must be masked.

The masks are in format of ds9 region files. They are given in terms of RA and Dec in J2000.0 coordinates. Each line starts with the word "polygon" followed by of a list of vertexes. The masks for each survey can be downloaded as a tarball using the following links:
- Deep: D.mask.rd.reg.tar.gz
- Wide: W.mask.rd.reg.tar.gz
Catalogue merging
The final step is to merge the catalogues. For the Deep fields, which do not overlap, the catalogues for the individual fields are simply concatenated. The pointings of the Wide fields however, overlap slightly. Simply concatenating the individual catalogues would lead to some sources being double-counted.
There are a few methods that can used to avoid double-counting. One is to divide the Wide fields with a grid corresponding the boundaries between pointings. Sources detected inside the boundary of a pointing are added to the catalogue. Source outside boundary are ignored since the will presumably be detected in the adjacent pointing. The problem with this method is that if there is any uncertainty in the position of objects near a boundary it may double counted (position errors may shift it over the boundary into both adjacent pointings) or be missed entirely (position errors may shift it out of both pointings).
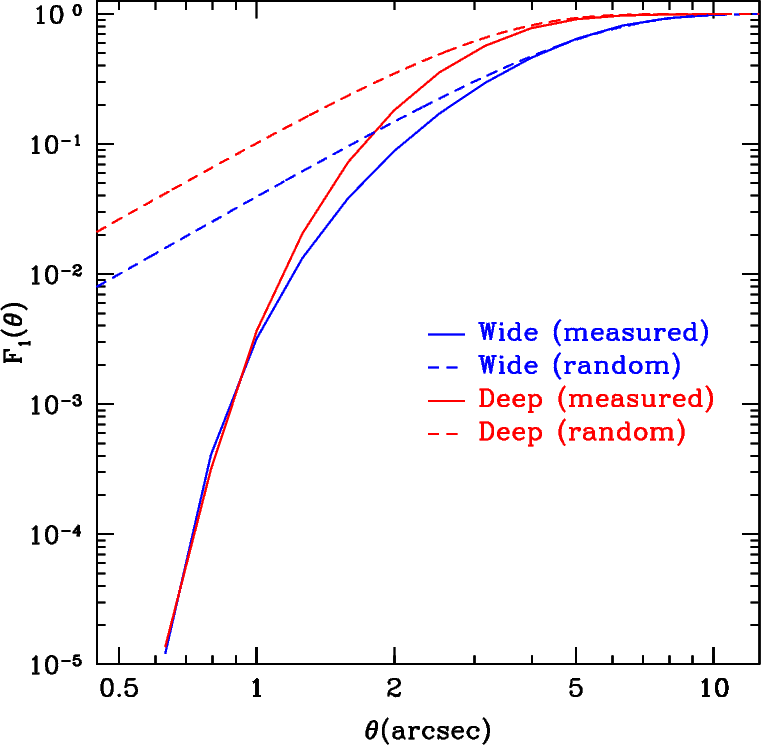
The other extreme is to include all objects from all the catalogues and then run a filter to determine which objects have been duplicated. Source which come from different catalogues but lie within some small radius of each other are probably the same source; one then eliminates the redundant source. The problem with this method is that the chance of two real different sources lying near each other may be non-negligible as shown in the figure below.
Probability of a source having a neighbour with a given radius. F1(θ) is the fraction of sources that have at least one neighbouring source within θ arcseconds. At large angles, the chance of having a neighbouring source approaches unity. The solid lines show the results as measured from the Deep and Wide survey respectively. The measured fraction drops sharply as θ drops below 1 arcsecond. This is because sources in close proximity are increasingly unlikely to be properly deblended. The dashed lines show the theoretical nearest neighbour fractions, assuming sources are distributed completely randomly (ignoring any galaxy clustering). Sources in the Deep fields are more likely to have a neighbour simply because the Deep fields, extending to fainter magnitudes, have a higher source density. For the wide fields, the chance of have a neighbour purely at random within 0.5'' is about 1%. The overlap zones between the wide pointings are typically a few arcminutes wide; having 1% of the sources in these non-negligible zones be missed is not acceptable.

Therefore, a hybrid method was adopted. The Wide fields are divided into grids as above but the boundaries were expanded by θoverlap arcseconds for each pointing so that they now overlap but only slightly . The overlap zone is now only 2θoverlap arcseconds wide. Setting θoverlap=10'' is large enough to accommodate the positional uncertainty of even fairly large, fuzzy objects, but small enough that missing 1% of the objects in these zones is acceptable. Source in each pointing catalogue outside the boundaries are trimmed. The trimmed catalogues are combined. Objects from different pointing catalogues lying with θmatch=0.5'' of each other are deemed to be the same object; the second entry is removed.
There are two parameters in this method: θoverlap and θmatch. Changing either parameter significantly (doubling or halving it) had only a very small effect on the final merged catalogues: the total number of sources would change by a few hundred in a catalogue of 30 million sources.
Boundaries were also applied at the edges of the fields. The boundaries lie at the point where the effective exposure time of the images (as indicated by weight map) drops to half of the nominal value. These boundaries apply the pointings at the edges of the Wide fields and to the Deep fields. Here is a list of the pointing boundaries.
- Date modified: