JHK WIRCam filters
This page describes the WIRCam JHK filters and contrasts them with the 2MASS JHK filters. Colour terms with respect to 2MASS are derived.
The WIRCam filter set
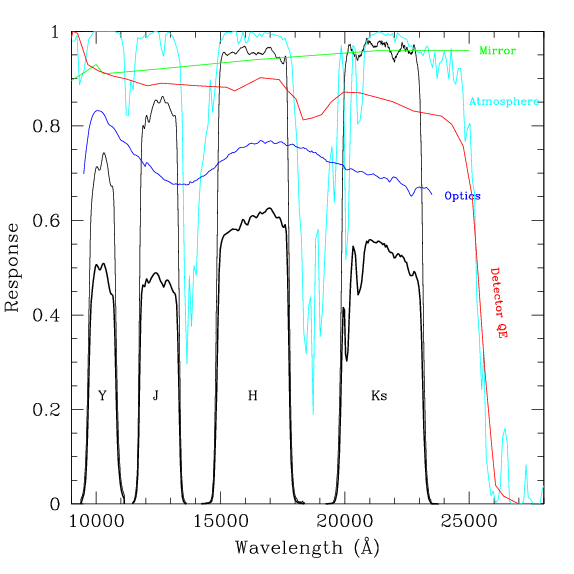
The figure below shows the WIRCam YJHK filter set. The light-coloured black lines show the filters' responses as obtained from the CFHT WIRCam filter page. The darker black lines show the final response after factoring in all of the following:
- The green line shows the reflectivity of the primary mirror.
- The blue line shows the transmission of the WIRCam optics.
- The red line shows the nominal QE of the HgCdTe HAWAII-2RG detectors. The curve is derived from Figure 1 of Finger et al. The response varies somewhat from detector to detector and with temperature. However, the response is (fairly) flat function of wavelength, so the effect on the shape of the final filter responses is small.
- The cyan line shows the transmission of the atmosphere. The curve was obtain from Gemini website; this curve shows the transmission for an water vapor column of 1.6 mm and an airmass of 1.5. The atmospheric transmission varies with changing airmass and water column. However it only substantially affects the red edge of the K filter. Since WIRCam uses a short K filter, the transmissions can be safely be neglected for most purposes.

The final response curves taking to account all of the above factors are given in text format here:
The WIRCam filters compared to the 2MASS filters
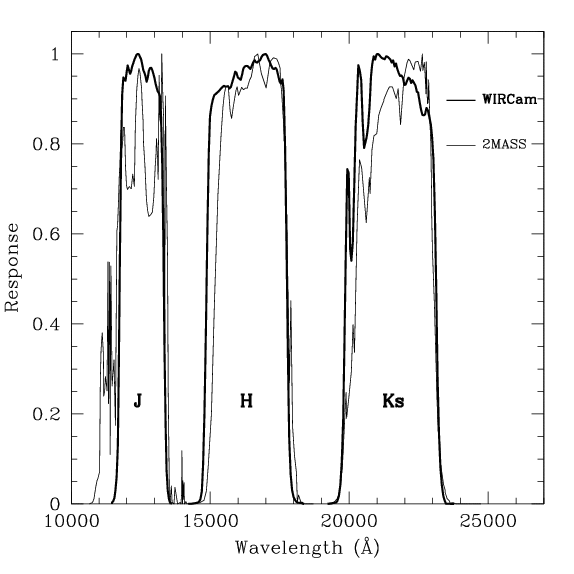
The figure below shows the WIRCam and 2MASS JHK filters. The transmission curves for the 2MASS filters were retrieved from 2MASS photometry documentation here. The filters are not identical. The WIRCam J filter is slightly redder than the 2MASS J, while the WIRCam H and Ks filters are slightly bluer.

The differences between AB and Vega magnitudes for both filter sets is given in the following table:
| Filter | Vega-AB 2MASS | Vega-AB WIRCam |
|---|---|---|
| J | -0.932 | -0.958 |
| H | -1.418 | -1.399 |
| Ks | -1.885 | -1.879 |
Small colour terms exist between the two filter sets. These colour terms were measured two ways:
- First, the filter responses described above were multiplied by the spectra of the Pickles stars. The resulting synthetic JHK photometry was used to measure colour terms. The main liability of this method is that, if either the spectra or the filter curves are not realistic, the derived colour terms will be erroneous.
- Second, colour terms were measured for several thousand WIRCam images by comparing the instrumental WIRCam magnitudes to the 2MASS photometry. Note that even if the photometric zero-point is unknown, the colour term can still be measured. The disadvantage of this method is that the WIRCam images are much deeper than the 2MASS images. Only the faintest 2MASS stars are not saturated. Therefore their colours tend to be noisier than desirable, producing large uncertainties in the measured colour terms
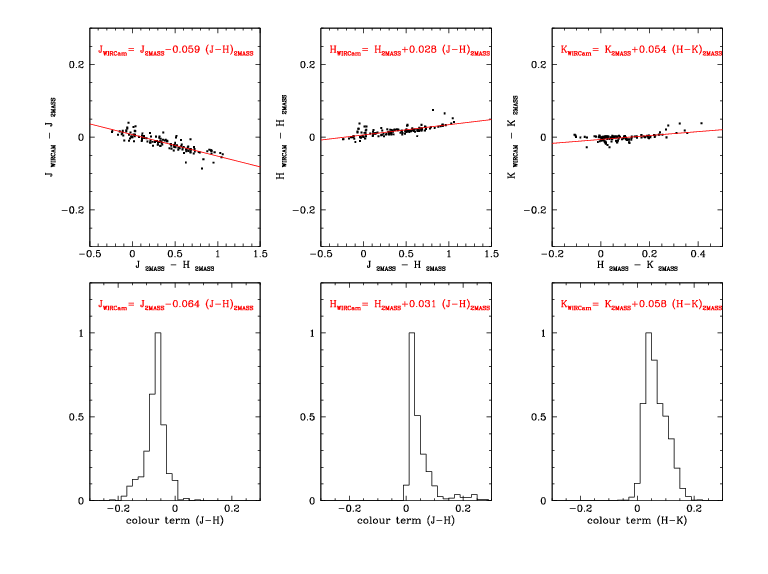
The results are shown below. The top panels show the results from synthetic photometry. The colour term equations shown are derived from linear fits to the synthetic photometry. The histograms on the lower panels show the distribution measured colour terms. The colour term equations shown represent the modal values of the colour term histograms.

The results are in close agreement, indicating that the filter responses are fairly realistic and that the measured colours, while noisy, have no systematic problems. The largest discrepancy is for the K band. Fortunately, the dispersion in stellar colours in H-K is fairly small (0.5 mags) so that a 0.009 shift in colour term only translates to a 0.0045 magnitude zero-point offset.
The observed colour terms were adopted:
J_WIRcam = J_2MASS - 0.064 * (J-H)_2MASS
H_WIRcam = H_2MASS + 0.031 * (J-H)_2MASS
K_WIRcam = K_2MASS + 0.058 * (H-K)_2MASS
- Date modified: