Selecting the best seeing images
When making best seeing stacks, one must decide how many input images to include and how many to throw away. There is trade-off between limiting magnitude and image quality (IQ). As one includes more images with increasingly bad image quality, the output image quality degrades while the depth increases.
Quantitatively, the IQ of a stack is very well estimated by the median of the IQ of its input images, ie, the IQ of input image N/2. To estimate the limiting magnitude, two assumptions were made: 1) the effects of IQ on depth are not important (not quite true) and 2) all the input images have the same exposure time (for the CFHTLS, Deep Fields, quite true). In this simplified case, the the limiting magnitude of a stack of N images goes approximately as 1.25 log10N.
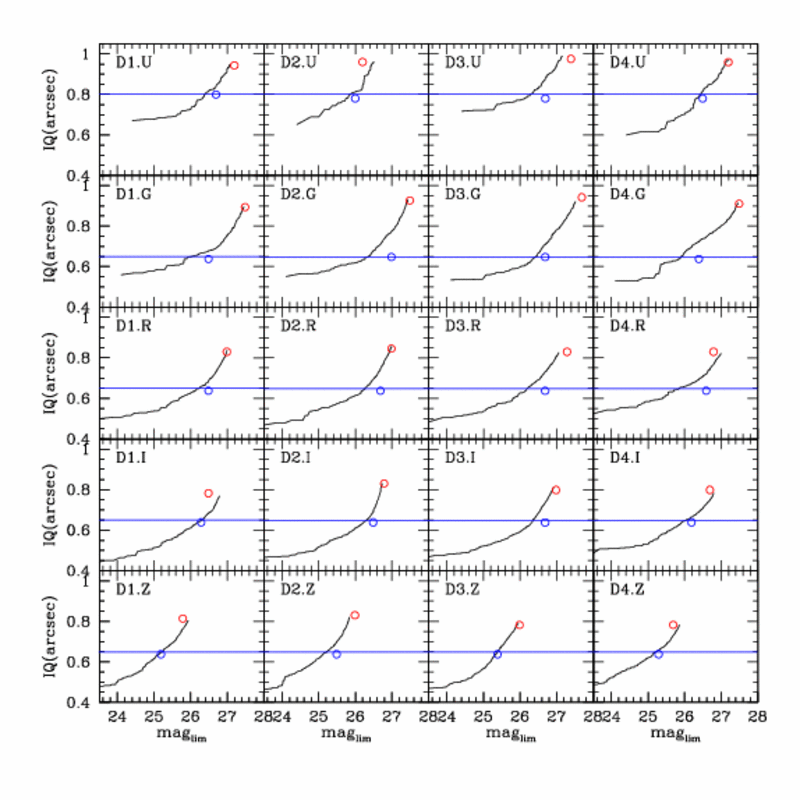
These two measures were applied to the input images of the CFHTLS Deep Fields. The images were sorted in order of image quality: best seeing first, worst seeing last. As the number input images increases, the image quality of the stack will be worse, but the limiting magnitude will be deeper. The results are shown in the grid of plots below. The expected image quality is plotted against expected limiting magnitude for each the 5 filters and 4 deep fields. The black lines show both IQ and limiting magnitude increasing with the number of images. The red points show the locus of the full stacks

The question becomes: is there a sweet spot on the graphs, where an improvement in image quality comes at only a small cost in limiting magnitude? Some of the graphs exhibit kinks where the slope of the line changes. Obviously, it is better to be at or slightly below these kinks. Ideally all the output images would have the same IQ, to increase the accuracy of matched aperture photometry.
Instead of picking a single threshold (for example stacking the best 25% of the images, or stacking only images with IQ=0.7'' or better) images were included to produce a desired output image quality. This is possible because, as shown by the red dots on the figure above, the median input IQ is an excellent predictor of the output IQ. Therefore, when choosing input images, one first sorts the images by increasing IQ. Then one goes down the ordered list until an input image with the target IQ is found, and then pick twice that number of images. For example, if one wants a 0.65'' seeing stack, and there are 41 images with seeing better than 0.65'', one should stack the best 82 images.
The chosen target image quality was 0.65'' for the GRIZ filters and 0.8'' for the U filter. Decreasing the seeing below 0.8 becomes rapidly prohibitive for the U-band. Similarly, the Z- and particular the G-band depths decrease rapidly if the target IQ is decreased even slightly. The U-band target is different than the other bands because targeting IQ=0.65'' would include no images, and targeting IQ=0.8'' in the other bands would improve the seeing slightly relative to the full stacks. The blue horizontal lines of the figure above show the target image qualities.
These criteria were applied to the input images of the CFHTLS Deep Fields and the chosen images were stacked. The resulting image quality and limiting magnitudes are plotted as blue dots on the figure above. The image quality is consistently on (or very slightly below) the prediction. The limiting magnitudes are usually better than predicted, since the prediction relies on the (not completely correct) assumption that IQ does not affect depth.
- Date modified: