NGVS catalog documentation

Back to the query page
Back to the NGVS Graphical Search Tool

Summary
This webpage describes how the unified NGVS catalog was generated. The catalog is available through the NGVS catalog query page or as a 8.4G ASCII file here.


Individual catalog generation
Catalogs were first determined for each NGVS pointing. SExtractor was run in 'double-image mode', using the g-band image as the detection image, and each of the ugriz bands in turn as the measurement image. The Mg002 images were used most the time; the exceptions are the background fields, where the Ml128 images were used. The Mg002 images were chosen over the Mg004 images because, although Mg004 images have superior background subtraction, the Mg002 have better photometric accuracy. Since SExtractor determines its own, local background, the superior background subtraction of the Mg004 images was not needed. Laura Ferrarese determined an optimal SExtractor configuration file, given here. For each pointing, the value of SExtractor parameter SEEING_FWHM was set to the value of image quality of the g-band image. The result is a set of 5 catalogs, one per band, with identical source lists and detection criteria (since they were all detected in g) with matched aperture photometry. If a band is missing for a pointing (for example, r is missing for almost all pointings) a fake catalog with values of zero everywhere was substituted. These 5 catalogs were concatenated by column to produce pointing catalogs.


Point source separation
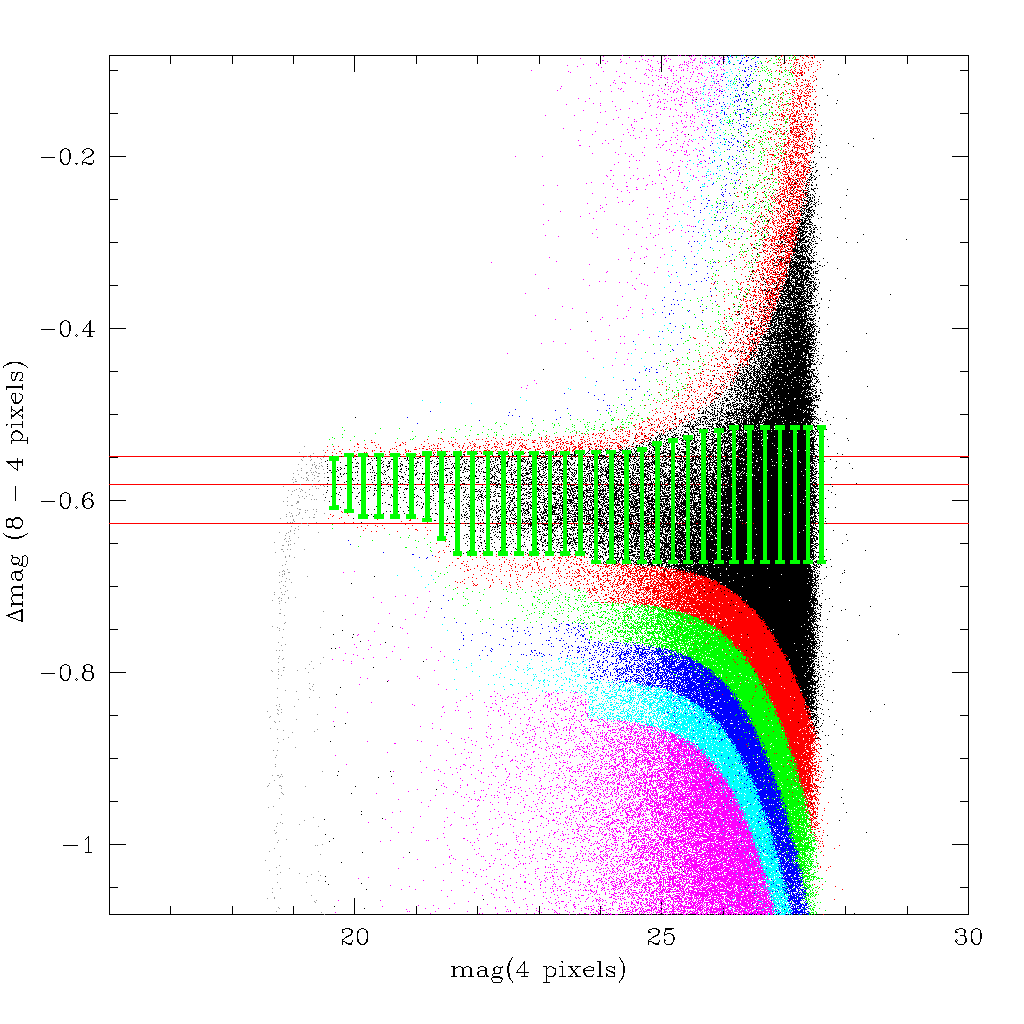
The point source separation is done using a growth curve (ie flux within a series of apertures). In particular, the algorithm uses the difference between the flux within a 4 pixel aperture to that in an 8 pixels aperture. Examine the figure at right. It plots the difference between these 2 magnitudes (ΔMag) against the magnitude within 4 pixels. You can see that stars fall along a very well defined and constant locus as a function of magnitude. The star classification algorithm automatically measures the position of this locus (ΔMagcen) on a field-by field basis, and then measures its width as a function of magnitude (σΔ). The centre of this locus is identified by the middlemost of the red horizontal lines. The upper and lower lines indicater the values of σΔ. Then, for each object, the classification (APS) flag corresponds to the distance that object is away from this locus in terms of the width of the locus at that magnitude (with an additional term corresponding to the photometric error in the ΔMag quantity, σMag). Positive means it lies above the locus (ie more concentrated than a star, Negative means it lies below the locus (ie less concentrated than a star). The formula used is

APS=(ΔMag-ΔMagcen)/(sqrt(σΔ2+σMag2))

The combined width (σΔ and M_ERR added in quadrature) is indicated on the plot at right by the green error bars. So the APS nnumber is effectively a probability that the object is stellar, with small (absolute) numbers corresponding to high probabilities that the souce is point-like.

Note that, when calculating the width of the stellar locus, bin sizes of 0.25 mags are used (or a minimum of 50 objects if the bin would contain less than 50 objects). Further, the width is calculated independantly above and below the position of the locus. Finally, the algorithm imposes additional constraint that the locus can never get thinner with fainter magnitudes, and that the width of the locus can never be more than twice the width calculated at bright magnitudes (to stop it blowing up at faint magnitudes).

This technique appears to work well to within approximately 1 magnitude of the completeness limits (ie to 24th magnitude or so). Below this, galaxies start being misidentified as stars.

In general, any objects within 1.5 sigma of the stellar locus in both filters have a very high probability of being stellar (modulo the caveat at faint magnitudes). Ultimately, inspection of the diagnostic plots, and the science case that is actually being addressed, will drive the selection criteria. The plot at right shows objects with different values of APS indicated by different colours:
black abs(APS)<1
red 1 <abs(APS)<1.5
green 1.5<abs(APS)<2
blue 2 <abs(APS)<2.5
cyan 2.5<abs(APS)<3
magenta3 <abs(APS)

In addition, in some fields you can see a sequence running parallel to the stellar sequence below the stellar sequence. These are globular clusters in Virgo, which are usually slightly more resolved than a star, and hence lie just below the stellar sequence. The APS value (Alan's Point Sourciness, named after Alan McConnachie) is computed for the g and i bands.
Point source diagnostic plot


Catalog Masking
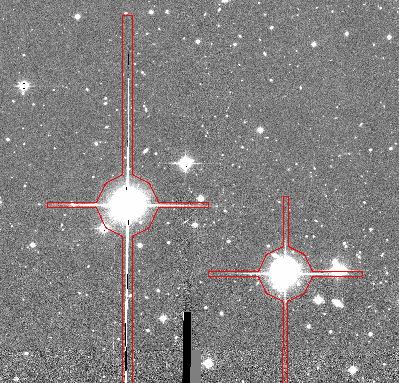
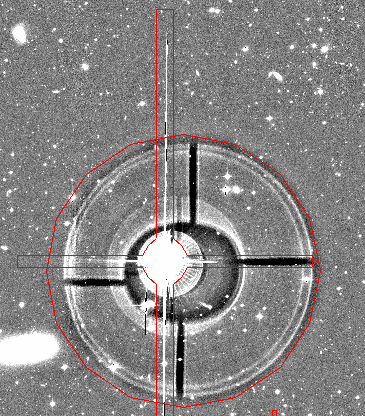
The catalogs were masked to identify areas where the detection and photometric measurements of sources may compromised. These areas include areas around brighter stars, diffraction and bleed spikes from the brightest stars and satellite/meteor trails. Also, in some cases the dither pattern of the input images was insufficient to provide uniform depth across the pointing. An automatic detection method was used to find the bright stars and the diffraction/bleed spikes. The images below show examples of what was masked.
An example of bright star masking. Here the position of the bright star is taken from the the Guide Star Catalog. (SExtractor usually fails to correctly determine the centre of bright stars.) The pupil image is offset from position of the star towards the centre of the image by 0.022 times the distance between the star and the centre of the image. Example of masked bright star
An example of diffraction spike masking. The masking program masks the diffraction spikes out to a minimum distance (200 pixels) and then looks for extended bleed spikes (always in the y-direction). If they are detected it extends the mask until the end of the bleed trail. Example of masked bleed spike


Extinction
The reddening coeffiecient E(B-V) was computed for each object. The values come from the extinction maps of Schlegel, Finkbeiner & Davis, 1998. The maps themselves and the software to read them were retreived from this website. The software was run on all the sources in the catalogs.

E(B-V) can be converted into extinction in each band using the following table. The table gives the filter, reference wavelength of and coefficient Aλ/E(B-V) as determine with the York Extincion Solver using the Fitzpatrick (1999) extincion law.
Filter Reference
Wavelength
Coefficient
u37474.594
g48573.560
r62722.464
i76311.813
z96351.221


Catalog merging
The pointings of the NGVS overlap slightly. Simply concatencating the individual catalogs generated for each pointing is un satisfactory, because there will be duplicate sources in the overlap regions. There are a few methods that can used to avoid double-counting:

One is to divide the NGVS fields with a grid corresponding the boundaries between pointings. Sources detected inside the boundary of a pointing are added to the catalog. Source outside the boundary are ignored since the will presumably be detected in the adjacent pointing. This is the "razor" method. The problem with this method is that if there is any uncertainty in the position of objects near a boundary it may double counted (position errors may shift it over the boundary into both adjacent pointings) or be missed entirely (position errors may shift it out of both pointings)

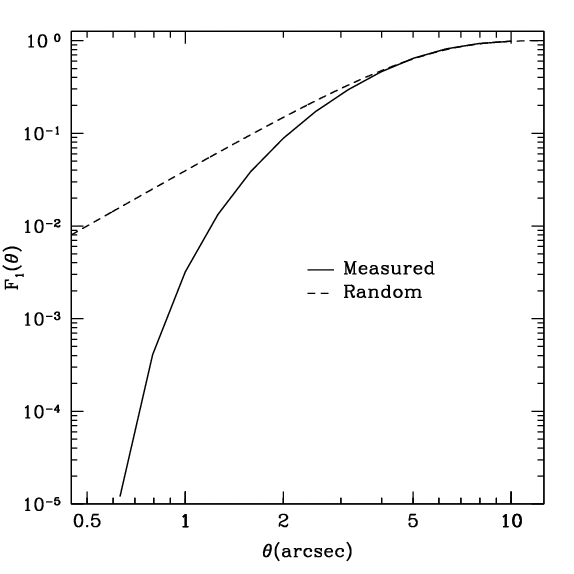
The other extreme is to include all objects from all the catalogs and then run a filter to determine which objects have been duplicated. Source which come from different catalogs but lie within some small radius of each other are probably the same source; one then eliminates the redundant source. This the "merge" method. The problem with this method is that the chance of two real different sources lying near each other may be non-negligible as shown in the figure below.

Probability of a source having a neighbour with a given radius. F1(θ) is the fraction of sources that have at least one neighbouring source within θ arcseconds. At large angles, the chance of having a neighbouring source approaches unity. The solid line shows the results as measured in the catalogs. The measured fraction drops sharply as θ drops below 1 arcsecond. This is because sources in close proximity are increasingly unlikely to be properly deblended. The dashed line shows the theoretical nearest neighbour fractions, assuming sources are distributed completely randomly (ignoring any galaxy clustering). The chance of have a neighbour purely at random within 0.5'' is about 1%. The overlap zones between the NGVS pointings are typically a few arcminutes wide; having 1% of the sources in these non-negligible zones be missed is not acceptable. Probability of a source having a neighbour with a given radius
Therefore, a hybrid method was adopted. The NGVS field is divided into grids as above but the boundaries were expanded by θoverlap arcseconds for each pointing so that they now overlap but only slightly . The overlap zone is now only 2θoverlap arcseconds wide. Setting θoverlap=10'' is large enough to accommodate the positional uncertainty of even fairly large, fuzzy objects, but small enough that missing 1% of the objects in these zones is acceptable. Sources in each pointing catalog outside the boundaries are trimmed. The trimmed catalogs are combined. Objects from different pointing catalogs lying with θmatch=0.5'' of each other are deemed to be the same object; the second entry is removed.

There are two parameters in this method: θoverlap and θmatch. Changing either parameter significantly (doubling or halving it) had only a very small effect on the final merged catalogs: the total number of sources would change by a few hundred in a catalog of 24 million sources.

Boundaries were also applied at the edges of the main NGVS field and the four background fields. The boundaries lie at the point where the effective exposure time of the images (as indicated by weight map) drops to half of the nominal value. A list of all the pointing boundaries can be found here.


Column definitions
The merged catalog is available through the NGVS catalog query page or as a 8.4G ASCII file: ngvs_cat.txt.gz. This section describes the columns in the catalog. Where the column has the same name as a SExtractor parameter, one might want to consult the SExtractor documentation for further details.

The first set of columns are values computed only once per object:
ngvsID Unique identifier for the source. The format is: NGVS-JHHMMSS.SS+DDMMSS.S
pointing The NGVS pointing in which the source was detected
pointing_area The area in sq. deg. of NGVS pointing in which the source was detected
masked_pointing_area The area in sq. deg. of NGVS pointing in which the source was detected, after accounting for the masking described above.
RA RA of the source in degrees
DEC Dec of the source in degrees
POS PGsphere coordinate of the source. (Only available in the database version of the catalog)
NUMBER Running object number
X_IMAGE Object position along x (pixels)
Y_IMAGE Object position along y (pixels)
A_WORLD Profile RMS along major axis (degrees)
B_WORLD Profile RMS along minor axis (degrees)
THETA_WORLD Position angle (east of north, degrees)
ERRA_WORLD Uncertainty in A_WORLD (degrees)
ERRB_WORLD Uncertainty in B_WORLD (degrees)
ERRTHETA_WORLD Uncertainty in THETA_WORLD (degrees)
APS_G Alan's point source index in g (see above)
APS_I Alan's point source index in i (see above)
EBV Extinction coffiecient E(B-V) (magnitudes) computed as described above.
masked Is this object masked? (true or false)
faint_or_masked Is this object masked or faint (G_MAG_AUTO<G_MAGLIMIT) ? (true or false)

The second set of columns are measured separately for each band. The actual columns have one of [UGRIZ] prefixed to the column name:
MAG_AUTO Kron-like elliptical aperture magnitude
MAGERR_AUTO RMS error for AUTO magnitude
MAG_ISO Isophotal magnitude
MAGERR_ISO RMS error for isophotal magnitude
MAG_ISOCOR Corrected isophotal magnitude
MAGERR_ISOCOR RMS error for corrected isophotal magnitude
MAG_BEST Best of MAG_AUTO and MAG_ISOCOR
MAGERR_BEST RMS error for MAG_BEST
MAG_APER1 Fixed aperture magnitude 3 pix
MAG_APER2 Fixed aperture magnitude 4 pix
MAG_APER3 Fixed aperture magnitude 5 pix
MAG_APER4 Fixed aperture magnitude 6 pix
MAG_APER5 Fixed aperture magnitude 7 pix
MAG_APER6 Fixed aperture magnitude 8 pix
MAG_APER7 Fixed aperture magnitude 16 pix
MAG_APER8 Fixed aperture magnitude 32 pix
MAG_APCOR1 Corrected fixed aperture magnitude 3 pix (further documentation here)
MAG_APCOR2 Corrected fixed aperture magnitude 4 pix (further documentation here)
MAG_APCOR3 Corrected fixed aperture magnitude 5 pix (further documentation here)
MAG_APCOR4 Corrected fixed aperture magnitude 6 pix (further documentation here)
MAG_APCOR5 Corrected fixed aperture magnitude 7 pix (further documentation here)
MAG_APCOR6 Corrected fixed aperture magnitude 8 pix (further documentation here)
MAG_APCOR7 Corrected fixed aperture magnitude 16 pix (further documentation here)
MAGERR_APER1 RMS error for fixed aperture magnitude 3 pix
MAGERR_APER2 RMS error for fixed aperture magnitude 4 pix
MAGERR_APER3 RMS error for fixed aperture magnitude 5 pix
MAGERR_APER4 RMS error for fixed aperture magnitude 6 pix
MAGERR_APER5 RMS error for fixed aperture magnitude 7 pix
MAGERR_APER6 RMS error for fixed aperture magnitude 8 pix
MAGERR_APER7 RMS error for fixed aperture magnitude 16 pix
MAGERR_APER8 RMS error for fixed aperture magnitude 32 pix
MU_MAX Peak surface brightness above background in mag arcsec-2
BACKGROUND Background at centroid position (counts)
ISOAREA_IMAGE Isophotal area above Analysis threshold (pixels)
FWHM_IMAGE FWHM assuming a gaussian core (pixels)
FLUX_RADIUS Half-light radius
FLAGS SExtractor extraction flags
CLASS_STAR SExtractor star/galaxy classifer output
KRON_RADIUS Kron apertures in units of A or B
PETRO_RADIUS Petrosian apertures in units of A or B
maglimit 5 sigma detection limit (fixed per filter/pointing)
iq Image quality (seeing) in arcseconds (fixed per filter/pointing)
 

Send comments/suggestions/problems to
Stephen.Gwyn@nrc.ca